Programing in R course / Master the R/Tidyverse
Date: 10 – 11 March 2020
Place: BIOCEV, Prumyslova 595, Vestec, seminar room yellow & blue (U2.020A + U2.020B)
Registration fee: 1,500 CZK (including VAT)
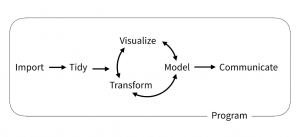
Master the R/Tidyverse is a two-day workshop focused on boosting your data analysis and visualization expertise. We will use R (https://www.r-project.org/), a free environment for statistical computing, and particularly its collection of packages Tidyverse (ggplot2, dplyr, tidyr, etc.) We will cover all the skills needed in a typical research project: from reading your data into R, choosing a nice tidy data format, through data transformations, statistical modelling and cool visualizations, to communicating results in a reproducible report (see the figure below).
You definitely do not have to be coders or statisticians to enjoy the course, just be motivated to learn new things. Some knowledge of R is helpful, but we welcome both beginners and intermediate users that just want to deepen their Tidyverse knowledge (never see R running?, don’t worry but study a bit in advance).
This two-day workshop will give you a thorough training in the family of R packages called Tidyverse. You will master publication-ready visualizations with ggplot2, data transformations and summarizing with dplyr and tidyr, working with dates, character strings, and untidy data formats, generating reproducible reports with R Markdown, reading data with fast readr functions and iterate through them with purrr package.
We will proceed through a series of exercises. After the workshop, you should be fluent in R data wrangling, exploration and modelling, and be prepared for more advanced topics. Every participant gets a collection of RStudio cheat-sheets.
The course is highly inspired by the Garrett Grolemund’s course Master The Tidyverse. Due to space capacity, the workshop will be strictly limited to 25 participants.
Preliminary outline
DAY 1 DAY 2
Visualization (ggplot2) Joining data, tidy data (dplyr, tidyr)
Data Manipulation (readr, dplyr) Strings, dates, factors (forecats, stringr, lubridate)
Reporting (rmarkdown) Iterating through data (purrr)
Lecturers:
Petr Simecek (https://cz.linkedin.com/in/simecekpetr)
I work as a data scientist at a startup studio Central European Ai institute (CEAi) in Brno, previously at Google (California, US). But for many years I was a bioinformatician, both at the Institute of Molecular Genetics (IMG, Prague) and at The Jackson Laboratory (Maine, US), focused mostly on mouse genetic data. I am R and Python enthusiast (having 15+ years of R experience, authoring several packages).
Vendula Novosadova (https://www.linkedin.com/in/vendula-novosadova-7113441a/)
I work as a Data Analyst at the Czech Centre of Phenogenomics (IMG CAS, BIOCEV, Prague) and I am head of the Bioinformatics unit. I put most generated data there together and try to find some meaning between them. I also try to explain people basics of the statistics and why not to create a pie chart.
Karla Fejfarova (https://www.linkedin.com/in/karlafejfarova)
I work as a biostatistician at the Czech Centre of Phenogenomics (IMG CAS, BIOCEV, Prague), which literally means helping other scientists with computer-related tasks: anything from tweaking Excel sheets and making plots to doing data analyses and training neural networks. The only thing I haven’t been asked to do is fixing a printer paper jam. You can usually find me staring at my computer screen or running in the woods.
Ashkan Zareie (http://linkedin.com/in/a-zre)
I am a Bioinformatics Analyst at the Czech Centre for Phenogenomics ((IMG CAS, BIOCEV, Prague). My main artilleries are R and Bash. Most of my time I spend on data analysis and visualization. On the other hand, I have developed pipelines for metabolomics data processing and have created web tools and applications in R Shiny.
Before the course:
Every participant must bring his or her own laptop. The participants are recommended to install a recent version of R (https://cloud.r-project.org/), RStudio (https://rstudio.com/products/rstudio/download/) and Tidyverse (https://www.tidyverse.org/). We will have cloud instances ready for anybody with the installation problems.
If you are interested in attending this course, please complete the registration form and attach a motivation letter. Both documents should be sent to: ccp-courses@img.cas.cz